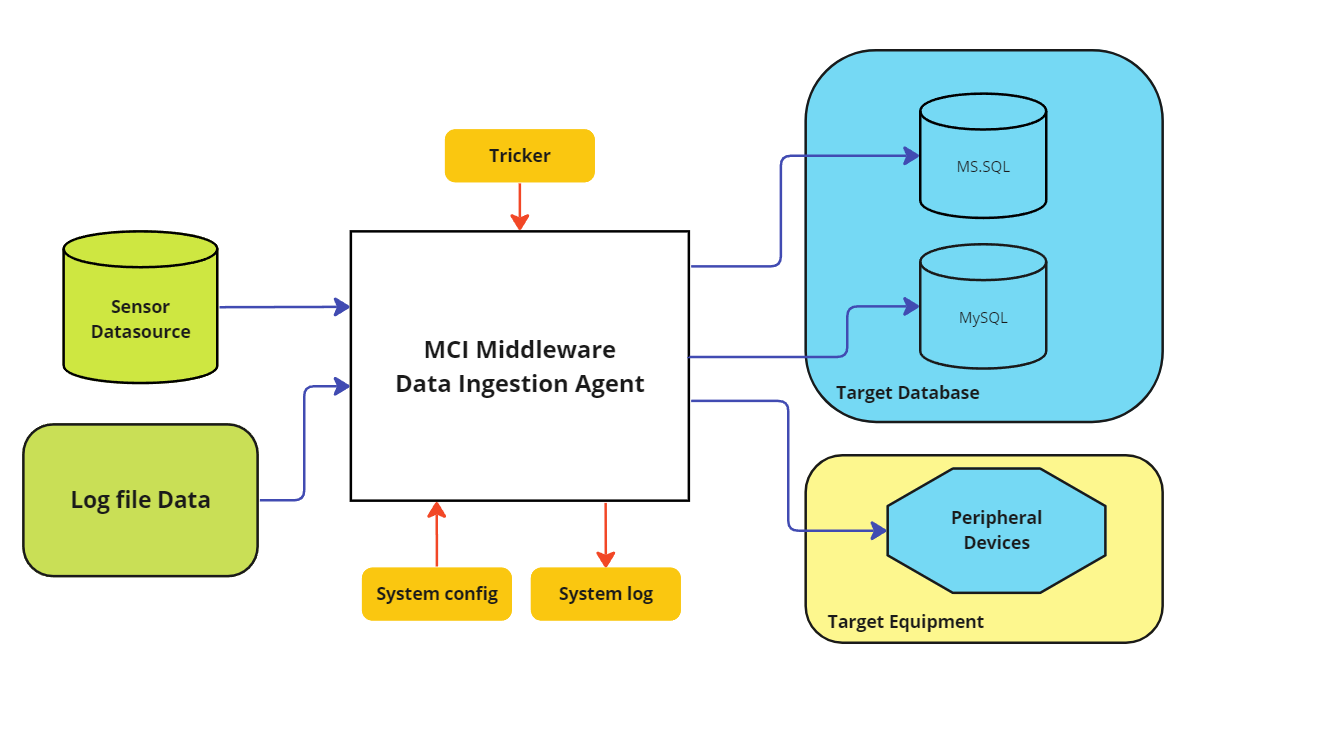
A software system that helps monitor and control the performance or condition of machines
Benefit
- Reduces difficulty in case sensor data is too varied. It is not easy to manage with monitoring if stored all in one place.
- Generate automatic summary reports to reduce the process of making documents, weekly reports or monthly summary reports.
- Supports data processing such as sensor calibration, automatic sensor data transformation.
- More convenient when receiving notifications via LINE Notify or Email. It also can be used with accessories such as Tower Lamp.
- Support various sensor in both type and brand. For examples,
- Power meter
- Temperature sensor
- Humidity sensor
- Vibration sensor
- etc
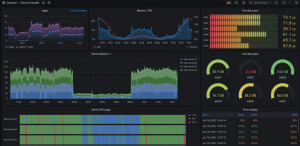
- Work with Data Visualization and Dashboard
- Grafana is a popular free dashboard creation tool. The program references data from various sources such as Graphite, InfluxDB, OpenTSDB or Elasticsearch. It is helpful to design a Dashboard that can create many charts according to users needs.